End-to-end Design Process
1. Project Overview
Goals
-
Introduce a new product module to the Chart platform
-
Understand user requirements for MVP
-
Design a high-fidelity prototype based on requirements
-
Ship designs to development within the prescribed timeline
Product
Chart is a data analytics platform designed to empower retail real estate professionals to make better leasing decisions. Chart's location data compiles a list of over 5,000 emerging brands that users can then filter to meet the needs of a specific space they are trying to lease. Emerging Brands is a concept developed for the Chart platform that provides a data-driven solution for leasing agents to find the best new brands for their properties.
Users
Retail strategy & leasing agents at large REITs
My Role: User Research & UI Design
-
Determining key research questions and selecting appropriate research methods given the goals and timeline
-
Writing the user interview protocol & questions
-
Synthesizing data from all team members & deriving key insights
-
Wireframing & prototyping using existing style guide and UI pattern library
-
Adding new UI patterns to Chart pattern library
-
Handoff to development
Team
-
Product/Team Lead
-
Product strategy & timing
-
Conducting user interviews & collecting data
-
-
Product Designer/Researcher
-
Collaborated on all aspects of design process
-
-
Data Scientist
-
Provide input on data availability and best practices
-
-
Developer
-
Provide input on technical feasibility and workload
-
Timeline
-
Feature selected from backlog to do further research
-
Research protocol developed
-
Professional conference 1 attended
-
Phone interviews conducted
-
Professional conference 2 attended
-
Data compiled and synthesized
-
Low-fidelity sketches
-
Medium-fidelity mockups
-
Final prototype completed & shipped to development
1. User Research
User Group: Leasing Agents
-
Find tenants for vacant space
-
Negotiate deals with new tenants
-
Create an optimum tenant mix to drive traffic to their properties
Hypothesis
Leasing agents struggle to find new/up-and-coming brands for their properties and lack a data-driven approach to determine if a new brand will be successful within their portfolio.

Research Methods
Interviews
-
Leasing agents from existing client base
-
Leasing agents at retail real estate conferences
MVP Testing
-
Presented users with a list of emerging brands without UI
-
Asked series of questions to address how users would interact with this data
User Interviews
Research Findings
After the team synthesized all of the data collected from the user interviews and MVP testing, we used affinity mapping to draw the following 4 key insights that we used to guide the design of our first prototype.
-
Filter by geography, category & total locations
-
Visualize brand footprint on a map
-
Provide a brand description and external links
-
Export custom list

Affinity Mapping
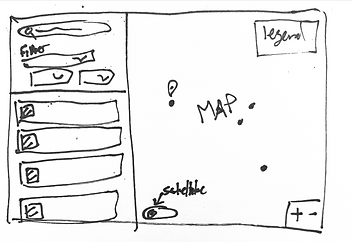
2. Wireframe Sketches
Examples of some of the initial paper sketches for the Emerging Brands module. The purpose of the sketching phase is to produce as many different ideas as possible with minimal ideas before moving on to digital wireframing.


3. Medium-Fidelity Mockups
Examples of some of the medium-fidelity mockups for the Emerging Brands module. During this phase it is important to:
-
Test a variety of layouts
-
Use minimal styling
-
Get input from developers & data scientists on technical feasability & development time


4. High-Fidelity Prototype
Screenshots from the final prototype for the Emerging Brands module. Each screenshot demonstrates how 1 or more of the key insights from the user research phase were addressed in the final design.
1. Filter by total locations

1. Filter by geography

2. Visualize brand footprint on a map &
3. Provide a brand description and external links

4. Export custom list

-
Slider selected as best-practice for usability when selecting a numbered range
-
New UI pattern added to the Chart UI pattern library
-
Default range set at 5-30 based on data from user interviews
-
Panel expands to allow for granular geographical filtering
-
Check-box selection pulled from existing UI pattern library
-
Allows for selection of any combination of regions, states, or metro-areas
-
Footprint visualization and brand description are nested within the row
-
Research demonstrated that these were useful pieces of secondary information so they are not displayed at the top level
-
Export pattern pulled from existing UI pattern library
-
Export formats determined by data from user interviews
5. Handoff
-
Final polish of high-fidelity mockups
-
Design Review
-
Demo interactive prototype for developers
-
Team asks clarifying questions (revisions made if necessary)
-
-
Sprint planning and grooming
-
Create and assign tickets based on finished design work
-

Excerpt from style guide showing button interactivity states
6. Next Steps
Usability Testing
-
Contextual inquiry with a group of pilot users
Feature Roadmap
-
Prioritize which features and data enhancements to build next
-
Based on user feedback and card sorting activities

Collaborators:
Jon Kowalski - Venture Principle, numo
Anna Lawn - Venture Designer, numo
Anthony Garuccio - Data Scientist, numo